

Bali tourism accommodation: what supply and occupancy data show
Bali had 9,509 accommodation units in 2025, while star-rated hotels averaged 60.62% occupancy. Official statistics also show strong foreign and domestic travel demand, with important differences by month and property type.
Editor: Mursyid Sonsang
· 2 min read
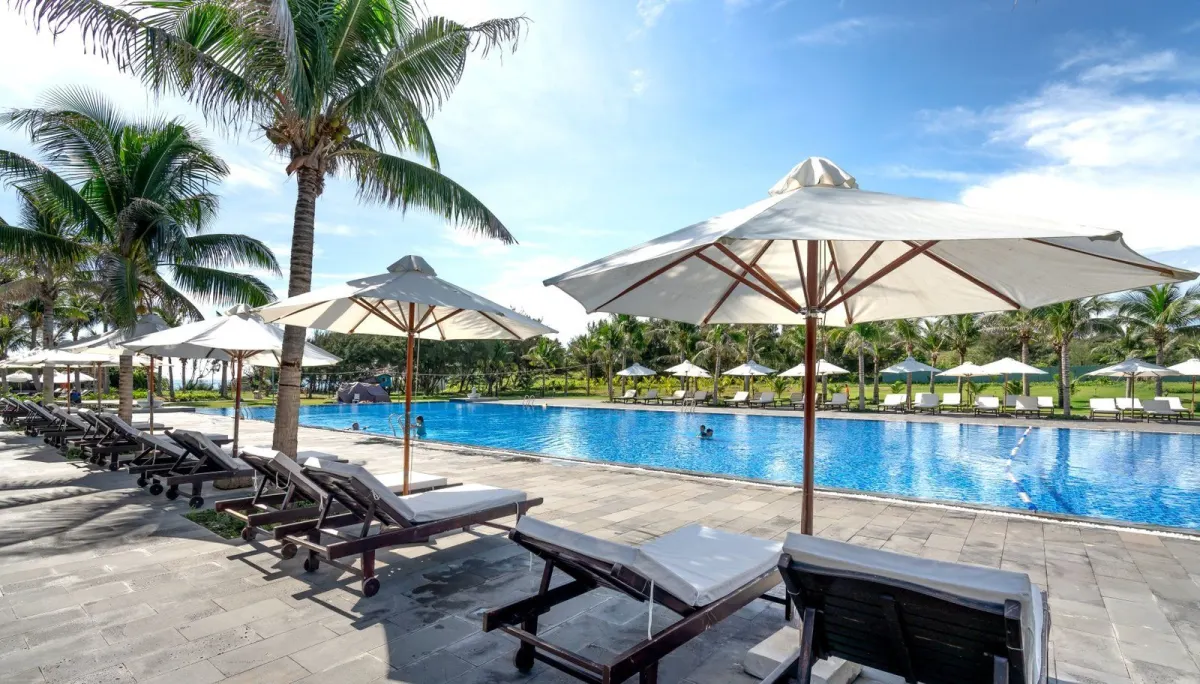
Bali’s tourism accommodation supply expanded sharply in 2025, while demand remained substantial: the province recorded 9,509 accommodation units and an annual average occupancy rate of 60.62% for star-rated hotels. The figures describe both the scale of the lodging market and how fully its star-hotel rooms were occupied.
How large was Bali’s accommodation supply in 2025?
Bali recorded 9,509 accommodation units in 2025, according to the Bali Provincial Tourism Office’s Bali Tourism Statistics 2025. Badung accounted for 5,258 units, followed by Klungkung with 1,011 and Gianyar with 806.
The same publication notes that the 2025 room-count format included many zero values and may not yet have been complete or fully updated. The unit total therefore describes registered accommodation units, not a complete count of available rooms.
What was Bali’s hotel occupancy rate?
The annual average room-occupancy rate for star-rated hotels was 60.62% in 2025, according to the Bali Provincial Tourism Office. This is an annual average, not a guarantee that an individual hotel or month reached that level.
Monthly occupancy fluctuated during the year. BPS-Statistics Indonesia reported that star-hotel occupancy reached 67.75% in July 2025, while non-star accommodation recorded 49.00% that month, according to its September 1, 2025 release.
How strong was visitor demand?
Bali received 3.98 million direct foreign-tourist visits from January through July 2025, up 12.46% from the same period in 2024, according to BPS-Statistics Indonesia. The July 2025 total alone was 697.11 thousand visits.
Domestic travel also contributed to demand. BPS recorded 2.29 million domestic tourist trips to Bali in July 2025, an increase of 31.96% from July 2024.
What do these figures mean for hotels and visitors?
The data show a large and expanding accommodation market alongside strong foreign and domestic travel flows. They do not, however, establish occupancy for every property, destination or accommodation category, because the annual 60.62% figure applies to star-rated hotels and the monthly BPS figures distinguish star-rated from non-star accommodation.
Sources
Read next
More on this story

East Indonesia Desk
How busy are hotels across West Nusa Tenggara?
Official September 2025 statistics show different occupancy and guest patterns for star-rated and non-star hotels across West Nusa Tenggara, including…
Most read in Tourism & Hospitality

Today’s top story

Related